Making Visible the Invisible
Artist
George Legrady
MediumDigital data on server, 3 computers, 6 LCD screens
DimensionsN.A.
ClassificationsIntegrated Art
Credit LineLibraries for All Bond 1% for Art funds
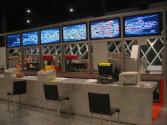
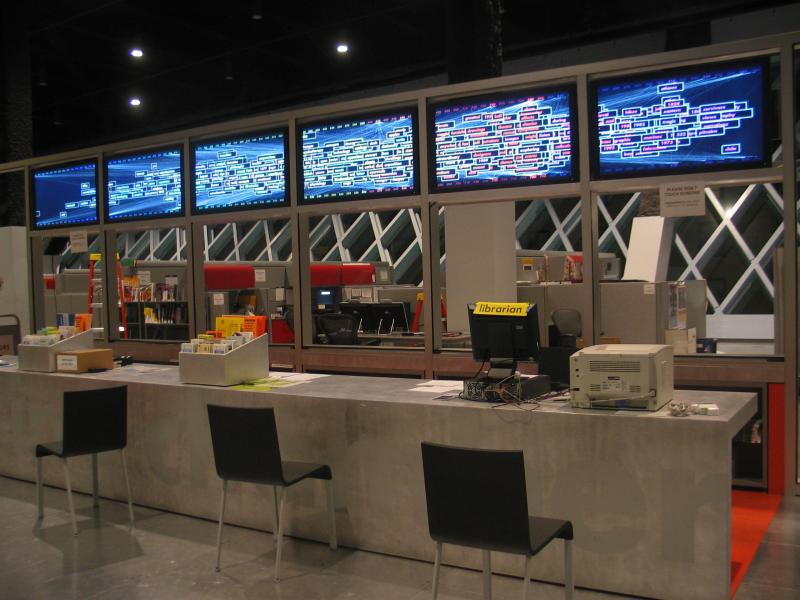
Description: Four visualizations that float across six LCD screens interpret live data regarding material that patrons have checked out from the Central Library within the past hour. The data is fed directly from the Library’s Information Technology department to the artwork, which is powered by three computers.
The first visualization, called “Statistics,” shows the number of books and other material such as DVDs, CDs and videos that patrons have checked out both within the past hour and for the day. The background color of the visualization changes throughout the day to visually note the passage of time.
The second visualization, called “Floating Titles,” consists of the titles of books and other materials that patrons have checked out in the past hour.
The third visualization, called “Dewey Dot Matrix,” shows the titles divided into Dewey classifications from 000 to 999. The titles of non-Dewey items such as fiction books float from the top to the bottom of the screen.
The fourth visualization, called “Keyword Map,” captures and displays keywords for items patrons have checked out.
Each visualization lasts between 1 and 6 minutes. The data flows either horizontally or vertically and is color-coded. In “Floating Titles”, for example, book titles are in red and titles of other media such as DVDs and CDs are in green.
Artist Statement: The concept is to try to show what the community is thinking based on the flow of books leaving the library. The visualizations show what people are reading.
The end goal is to work with the technological and mathematical set of processes and come out with an aesthetic and poetic experience.
Location: Central Library, 1000 Fourth Avenue, Seattle WA 98104
Location: Central Library, 1000 Fourth Avenue, Seattle WA 98104


